Statistikk 2015 1. januar 2016
Posted by alfedgar in Årsrapport.add a comment

Crunchy numbers
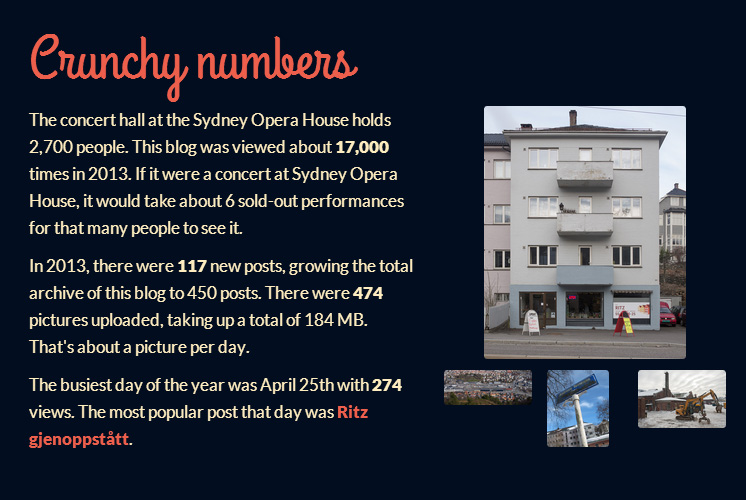
The concert hall at the Sydney Opera House holds 2,700 people. This blog was viewed about 27,000 times in 2015. If it were a concert at Sydney Opera House, it would take about 10 sold-out performances for that many people to see it.
There were 440 pictures uploaded, taking up a total of 179 MB. That’s about a picture per day.
The busiest day of the year was January 11th with 589 views. The most popular post that day was Nina.
These are the posts that got the most views in 2015.

How did they find you?
The top referring sites in 2015 were:
- facebook.com
- startsiden.no
- streetartoggatekunst.origo.no
- frame.bloglovin.com
- disqus.com

That’s 82 countries in all!
Most visitors came from Norway. United Kingdom & The United States were not far behind.
Årsrapport 2014 1. januar 2015
Posted by alfedgar in Årsrapport.add a comment


These are the posts that got the most views in 2014.
- 1 Mindemyren 3 comments
- 2 Kronstad 0 comments
- 3 Wergeland 0 comments
- 4 Kontakt 9 comments
- 5 Løvstien 0 comments
2013 in review 1. januar 2014
Posted by alfedgar in Årsrapport.add a comment

Attractions in 2013
These are the posts that got the most views in 2013.
- Ritz gjenoppstått 3 COMMENTS April 2013
- Før Wergeland Terrasse 0 COMMENTS February 2013
- Kunstgress på Rautjern? 0 COMMENTS April 2013
- Kanalveien 11, et hull. 2 COMMENTS April 2012
- Geng 3 COMMENTS March 2013
How did they find you?
The top referring sites in 2013 were:
facebook.com
bloglovin.com
startsiden.no
fotomuseum-bedrift.origo.no
bab.bergen360.no

[From annual report, wordpress.com]
2012 in review 1. januar 2013
Posted by alfedgar in Årsrapport.add a comment

Crunchy numbers
600 people reached the top of Mt. Everest in 2012. This blog got about 10 000 views in 2012. If every person who reached the top of Mt. Everest viewed this blog, it would have taken 17 years to get that many views.
In 2012, there were 119 new posts, growing the total archive of this blog to 333 posts. There were 354 pictures uploaded, taking up a total of 126 MB. That’s about 7 pictures per week.
The busiest day of the year was 12. november with 164 views. The most popular post that day was Kronstad.
These are the posts that got the most views in 2012.
1 Lett å få tak i pizza, februar 2011
2 Fanahallen og omegn, mai 2010
3 Lys i biblioteket, mars 2012
4 Gullbusk og rhododendron, april 2011
5 Kanalveien 11, et hull, april 2012
Some visitors came searching, mostly for mindemyren, kronstadparken, leaparken, fanahallen, og bybanen.
The top referring sites in 2012 were:
startsiden.no
bloglovin.com
nybygg.hib.no
bab.bergen360.no
aib.bergen360.no
2011 in review 1. januar 2012
Posted by alfedgar in Årsrapport.add a comment
The WordPress.com stats helper monkeys prepared a 2011 annual report for this blog.

Here’s an excerpt:
A New York City subway train holds 1,200 people. This blog was viewed about 4 900 times in 2011. If it were a NYC subway train, it would take about 4 trips to carry that many people.
In 2011, there were 78 new posts, growing the total archive of this blog to 205 posts. There were 188 pictures uploaded, taking up a total of 57mb. That’s about 4 pictures per week.
The busiest day of the year was august 26th with 149 views. The most popular post that day was Kronstad.
How did they find you?
The top referring sites in 2011 were:
aib.bergen360.no
no.wordpress.com
bab.bergen360.no
facebook.com
nybygg.hib.no
Some visitors came searching, mostly for mindemyren, pizza wergeland, fanahallen, trikkesløyfen, og kronstadparken.
Attractions in 2011
These are the posts that got the most views in 2011.
1 Lett å få tak i pizza 0 comments februar 2011
2 Fanahallen og omegn 1 comment mai 2010
3 Dreieskive 1 comment januar 2011
4 Bybanen sett i fugleperspektiv 0 comments juni 2011
5 Mer arbeid i krysset Kanalveien/Minde Allé 3 comments juli 2011
2010 in review 1. januar 2011
Posted by alfedgar in Årsrapport.add a comment
The stats helper monkeys at WordPress.com mulled over how this blog did in 2010, and here’s a high level summary of its overall blog health:

The Blog-Health-o-Meter™ reads This blog is doing awesome!
Crunchy numbers
A Boeing 747-400 passenger jet can hold 416 passengers. This blog was viewed about 1,800 times in 2010. That’s about 4 full 747s.
In 2010, there were 70 new posts, growing the total archive of this blog to 125 posts. There were 186 pictures uploaded, taking up a total of 57mb. That’s about 4 pictures per week.
The busiest day of the year was December 13th with 97 views. The most popular post that day was Wergeland.
Where did they come from?
The top referring sites in 2010 were aib.bergen360.no, skyscrapercity.com, facebook.com, no.wordpress.com, and bab.bergen360.no.
Some visitors came searching, mostly for mindemyren, fanahallen, bybanen, minde trelast, and bendixens vei 63.
Attractions in 2010
These are the posts and pages that got the most views in 2010.
Wergeland February 2010
Kronstad February 2010
Mindemyren November 2009
Fanahallen og omegn May 2010
Svartor, Alnus glutinosa August 2010